
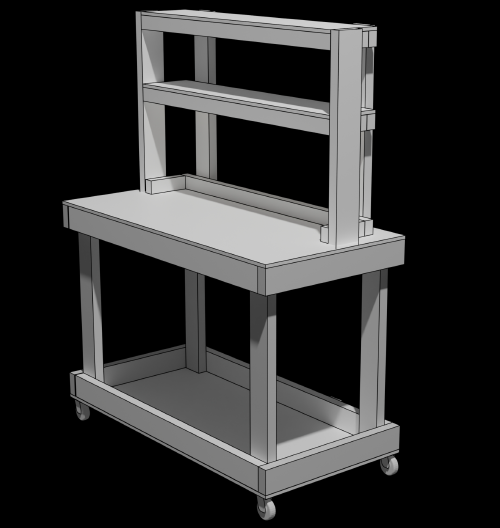
After a couple of unsatisfactory attempts, I’ve landed on this design. (Shown in place on one of the carts, which are already built.) The idea is that there will be slots in the workstation top to receive the shelf legs, giving a secure fit, but also allowing the shelf to be easily removed when the workstation is needed for other duty.
While many of Plim’s displays will be defined fairly clearly by the data structures, a few are crucial to the success of the the app and should be given more considered attention.
◇◆◇◆◇◆◇◆◇◆◇◆◇◆◇◆◇◆◇
Snapshot
The single most important display is the one that summarizes the state of the budget. Remember that this display is focused on a specific moment in time (the focus timestamp) and is being viewed from a specific moment in time (the as_of timestamp). It’s the heart monitor of the budget, presenting the most crucial information about the state of your budget.
 Here’s a sketch of what the display will look like. It’s just a text file, rendered into a PNG using carbon.
In practice, I expect the number of buckets to be significantly higher than shown here, so we may need a more compact buckets list.
Possible Solutions:
-
Only show buckets that are empty or near-empty (leaks > 75% of fills)
-
Buckets could be declared hierarchically, and snapshot only shows the top level sums
Validation Report
A group of cross checks that confirm the budget files and totals are balanced and correct.
Sketch image coming here.
Trends Report
Comparison of current month to:
-
same point in previous month
-
same point in this month last year
-
same point in average of last 12 months
Sketch image coming here.